Divergence monitor
A practical setup and observation guide for the proprietary Divergence monitor indicator. This guide covers its chart placement and usage workflow without reconstructing unpublished calculations.
Add and configure
- Open the indicator library, choose Plus in the advanced section and locate Divergence monitor.
- Click the row to add it to the separate indicator pane. If it is already marked as on the chart, locate the existing instance before adding another.
- Open indicator settings and record the parameters currently exposed. Names, defaults and editability depend on the current version; this guide does not invent unpublished defaults.
- Fix the symbol, timeframe, price adjustments and settings before observing bars. After a change, confirm that the chart has recalculated.
Observe the displayed result
The catalogue places this indicator on the separate indicator pane. Record the displayed labels and settings, then compare closed bars before interpreting a change. Signal and colour meanings require author documentation.
This indicator occupies a separate pane. Align the time positions with price, and do not assume that its vertical-axis values are prices or returns.
For a new colour, label or icon, record the displayed label, time and settings first. Use a meaning only when the author has documented it; red or green alone does not define a buy or sell instruction.
Actual application chart
This screenshot shows Divergence monitor running on the application's MSTR daily chart. Price and indicator share the same market history, preserving the curves, bars and markers drawn by the application.
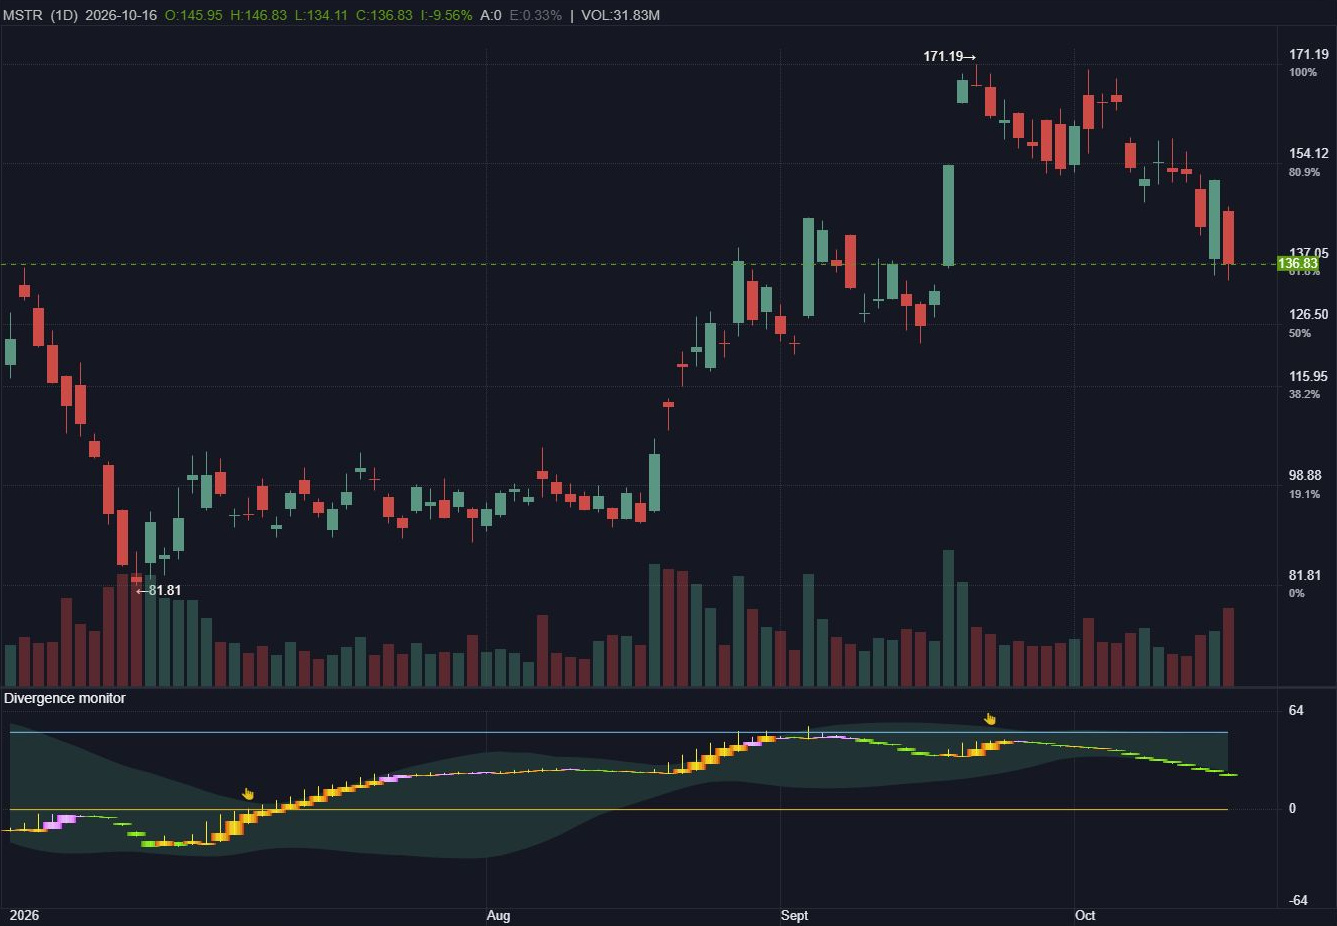
The catalogue places this indicator on the separate indicator pane. Record the displayed labels and settings, then compare closed bars before interpreting a change. Signal and colour meanings require author documentation.
- Check the displayed indicator name and parameters against the version currently loaded.
- Align price and indicator by time, then compare direction, turning points and marker locations.
- After changing settings or timeframe, wait for calculation to finish before saving the same interval for comparison.
The screenshot records a historical chart display, not executed orders, returns or a win rate.
Known information and usage limits
- The catalogue confirms separate indicator pane placement and Plus classification. Actual account access follows the application’s current entitlement message.
- The calculation is unpublished. This guide does not infer weights, thresholds, signal direction, repainting behaviour or performance.
- A display on an open bar can keep changing. To examine whether historical markers change, save the same historical window at different times and compare it.
- Resolve preview masking, entitlement messages or missing inputs before interpreting the display. A masked or empty region does not mean that the indicator produced no signal.
Questions
What if a parameter meaning is not documented?
Retain the original settings and a screenshot, then confirm with the author. Do not infer the calculation from a name or colour.
Do these steps establish a win rate?
No. This workflow supports chart observation and review; it is not a strategy backtest or an execution record.