Bollinger bands
Adds standard-deviation bands around a moving-average centre.
Purpose and construction
Adds standard-deviation bands around a moving-average centre.
Bollinger bands is applied to the chart series using the local definition below. Each period counts one bar on the active chart. The same period therefore covers a different amount of time on daily and intraday charts.
How to read it
Band width describes volatility. A band touch alone does not confirm a reversal.
Confirm the inputs and settings before comparing the indicator with price. On an open bar, close, extremes and volume can still change, so the reading can update before the bar closes.
Parameters
| Parameter | Default |
|---|---|
M | 20 |
Parameter names match the variables in the calculation. After changing a lookback or smoothing period, recalculate on the same data to compare response speed. Defaults from another platform may not match this definition.
Actual application chart
This screenshot shows Bollinger bands running on the application's TSLA daily chart. Price and indicator share the same market history, preserving the curves, bars and markers drawn by the application.
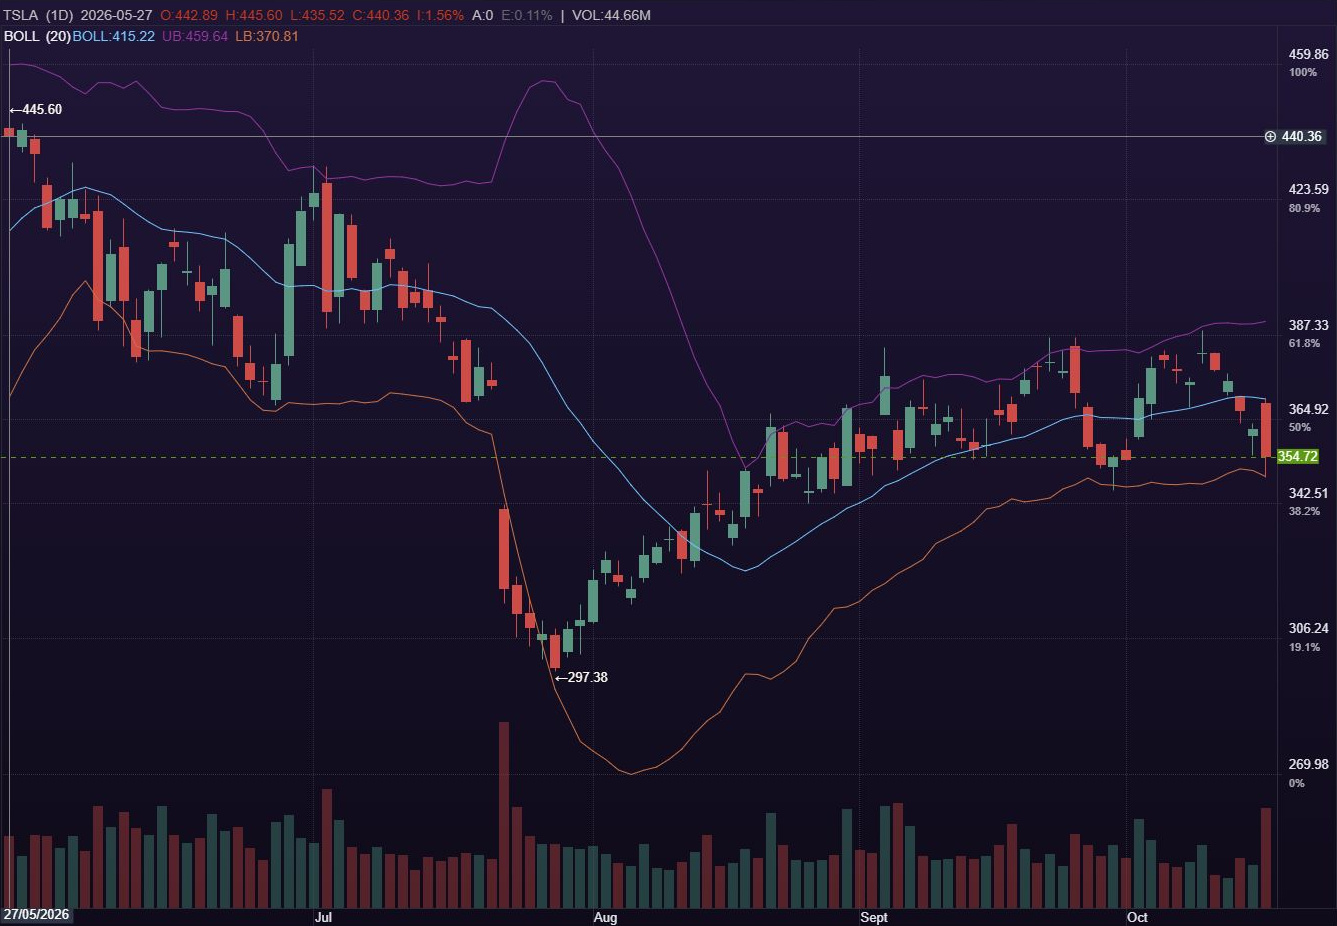
Band width describes volatility. A band touch alone does not confirm a reversal.
- Check the displayed indicator name and parameters against the version currently loaded.
- Align price and indicator by time, then compare direction, turning points and marker locations.
- After changing settings or timeframe, wait for calculation to finish before saving the same interval for comparison.
The screenshot records a historical chart display, not executed orders, returns or a win rate.
Local calculation
The local definition is shown below. Display labels can be translated; the case calculation uses original source identifiers. A shared indicator name does not guarantee identical calculations across platforms.
BOLL:MA(CLOSE,M);
UB:BOLL+2*STD(CLOSE,M);
LB:BOLL-2*STD(CLOSE,M);
Limitations
- Band width describes volatility. A band touch alone does not confirm a reversal.
- Timeframe, adjustments, warm-up length and data units affect results. Align these before comparing charts.
Questions
Why can Bollinger bands differ across platforms?
Compare inputs, default periods, smoothing, offsets and data units before comparing the final value. This guide uses the local source definition rather than assuming that an external example has the same settings.
Does the example show a real trade?
No. Figures show the indicator running on historical market data in the application. They contain no executed orders and make no return or win-rate claim.
References
The calculation comes from the project’s indicator registry. Primary references below provide related conceptual reading. Figures are captured from the running application.